What is Technical Analysis ?
It is a financial analysis that looks at price action to determine trends and future price targets in financial markets.
Over the last twenty years I have trained many people in Technical Analysis.
Over that time, listening to what people wanted to learn about I have built 3 foundation modules/courses details of which can be found on the following slides
You can see some of the feedback from people who have completed these modules on our testimonials page
The 3 courses that have proved very popular are:
1) The first is to understand the basic concepts and essential I feel to truly build a good base in technical analysis.
2) The second builds on the basics by adding on secondary indicators to the chart analysis.
3) The third covers the very popular subject of Japanese charting, covering Candlesticks and the Ichimoku Study
Full details of these training courses and pricing can be found on the following slides.
However, if you would like to pick and choose which topics to cover and build a tailor-made training package, please contact me
The crucial and often overlooked area of Technical Analysis….
Topics that will be covered
Why it’s important to use Technical Analysis over/ in addition to Fundamental Analysis
The difference between line, bar and Candle charts
How support and resistance levels are formed
The importance of the Rule of Polarity in Financial Markets
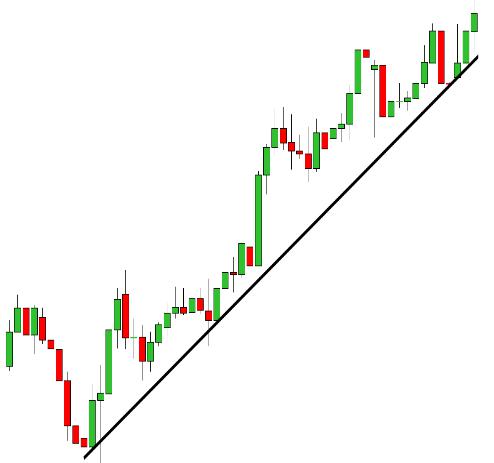
Learn how to identify trends/counter trends to understand who is in control of any particular market.
A study of how to spot and use many continuation and reversal patterns
You didn’t learn to drive in an F1 car and there is a reason that you start in a basic car and build up once that is mastered. The same applies to Technical Analysis, start with the basics and once mastered, your journey to understanding possible future price movements will have begun.
Learn how to know who is in control of the Market.
The Buyers or Sellers ?
Whereas the first Module was all subjective (what do we see on the chart), the second module is all objective as it’s all mathematical formula driven studies to add on to the chart to help see who is in control.
Topics that will be covered
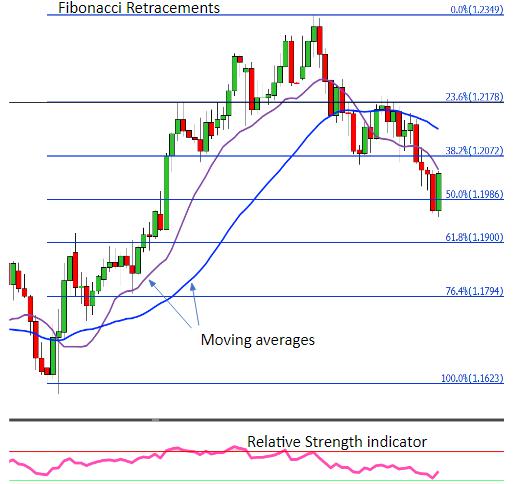
We start with the Fibonacci Sequence and its relevance in Financial markets
We will cover how the Market uses Fibonacci retracements, projections and Extension swings to predict future price ranges and targets, along with the Rule of Polarity, yet again, coming into play.
We then cover Moving Averages and their different uses in financial markets as support/resistance along with their use as buy and sell signals as crossover points to signal/confirm directional change.
Then we will cover moving average range-based systems such as Bollinger bands.
Finally, we will cover the Relative Strength Indicator and how that can warn and confirm a price reversal.
The Third module is personally my favourite, because after I learnt these techniques, it really increased my confidence in talking to and doing deals with clients for the next 25 years of my career.
Topics that will be covered
We start with the history/development of Japanese candlesticks and why/how these candle charts are now universally used by people to help them predict Financial Market movements hundreds of years after their creation.
We cover many of the different candlestick patterns which affect the markets, starting with single candle patterns, then 2 candle patterns and finally 3 candle patterns.
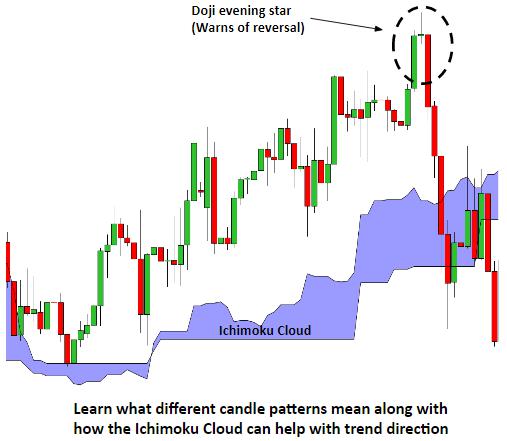
We finish by looking at the Ichimoku Cloud, covering how it is formed and some of the basic uses of the Ichimoku Cloud.
Learn how the markets still react to the same patterns now that were designed by a rice trader in japan in the 1700’s.
Discover and understand many different types of candle formations including Gravestone Doji, Hanging man along with Hammers amongst others and be prepared for their impact on the markets.
Turning Japanese – Studies originating from Japan
These sessions can be tailor-made to cover and include markets that are specific to you/your company, or we can observe an array of Equity, FX, Bond and Commodity markets.
These courses are designed for small groups of between 10 to 20 people at a time and for the whole group the total cost is GBP 2,000 + VAT. ( So only GBP 100 per person if there are 20 of your employees in the class).
We can train a class of any size and mix the topics covered to suit any requirements you may have, we simply suggest between 10 to 20 people as past experience show it’s the optimum size for people to fully engage with questions and learn this fascinating subject.
The duration of this course is between 2 to 3 hours, which includes a 15 minute refreshment break. I am happy to travel and do the training to your offices in order to minimize traveling and disruption to your staff. We can always change the length to suit your requirements.

What is Technical Analysis and Training Courses available
What is Technical Analysis ?
It is a financial analysis that looks at price action to determine trends and future price targets in financial markets.
Over the last twenty years I have trained many people in Technical Analysis.
Over that time, listening to what people wanted to learn about I have built 3 foundation modules/courses details of which can be found on the following slides
You can see some of the feedback from people who have completed these modules on our testimonials page
Training Courses available
The 3 courses that have proved very popular are:
1) The first is to understand the basic concepts and essential I feel to truly build a good base in technical analysis.
2) The second builds on the basics by adding on secondary indicators to the chart analysis.
3) The third covers the very popular subject of Japanese charting, covering Candlesticks and the Ichimoku Study
Full details of these training courses and pricing can be found on the following slides.
However, if you would like to pick and choose which topics to cover and build a tailor-made training package, please contact me
Module 1 : Explaining the basic principles of Technical Analysis
The crucial and often overlooked area of Technical Analysis….
Topics that will be covered
- Why it’s important to use Technical Analysis over/ in addition to Fundamental Analysis
- The difference between line, bar and Candle charts
- How support and resistance levels are formed
- The importance of the Rule of Polarity in Financial Markets
- Learn how to identify trends/counter trends to understand who is in control of any particular market.
- A study of how to spot and use many continuation and reversal patterns
You didn’t learn to drive in an F1 car and there is a reason that you start in a basic car and build up once that is mastered. The same applies to Technical Analysis, start with the basics and once mastered, your journey to understanding possible future price movements will have begun.
Learn how to know who is in control of the Market. The Buyers or Sellers ?

Module 2 : Discover the importance of Fibonacci and moving averages on Financial Markets.
Whereas the first Module was all subjective (what do we see on the chart), the second module is all objective as it’s all mathematical formula driven studies to add on to the chart to help see who is in control.
Topics that will be covered
- We start with the Fibonacci Sequence and its relevance in Financial markets
- We will cover how the Market uses Fibonacci retracements, projections and Extension swings to predict future price ranges and targets, along with the Rule of Polarity, yet again, coming into play.
- We then cover Moving Averages and their different uses in financial markets as support/resistance along with their use as buy and sell signals as crossover points to signal/confirm directional change.
- Then we will cover moving average range-based systems such as Bollinger bands.
- Finally, we will cover the Relative Strength Indicator and how that can warn and confirm a price reversal.

Module 3 : Understanding the magic of Candle charts and the Ichimoku cloud
The Third module is personally my favourite, because after I learnt these techniques, it really increased my confidence in talking to and doing deals with clients for the next 25 years of my career.
Topics that will be covered
- We start with the history/development of Japanese candlesticks and why/how these candle charts are now universally used by people to help them predict Financial Market movements hundreds of years after their creation.
- We cover many of the different candlestick patterns which affect the markets, starting with single candle patterns, then 2 candle patterns and finally 3 candle patterns.
- We finish by looking at the Ichimoku Cloud, covering how it is formed and some of the basic uses of the Ichimoku Cloud.
Learn how the markets still react to the same patterns now that were designed by a rice trader in japan in the 1700’s. Discover and understand many different types of candle formations including Gravestone Doji, Hanging man along with Hammers amongst others and be prepared for their impact on the markets.
Turning Japanese – Studies originating from Japan

Price
These sessions can be tailor-made to cover and include markets that are specific to you/your company, or we can observe an array of Equity, FX, Bond and Commodity markets.
It is designed for small groups of up to 10 people and only costs £1,000+VAT (Just GBP 100 + VAT per person if for a class of 10 people).
We can of course train a class of any size and mix the topics covered to suit you, we simply suggest 10 as past experience shows it’s the optimum size.
The duration of this course is 2-3 hours (Including a 15-minute break) and would be “ in house” at your premises
(Length can be changed to suit your requirements)